Every Signal That Matters. One Live Dashboard.

Traffic. AI attribution. Search. Customers. Geography. ROI. All inside Neural Core.

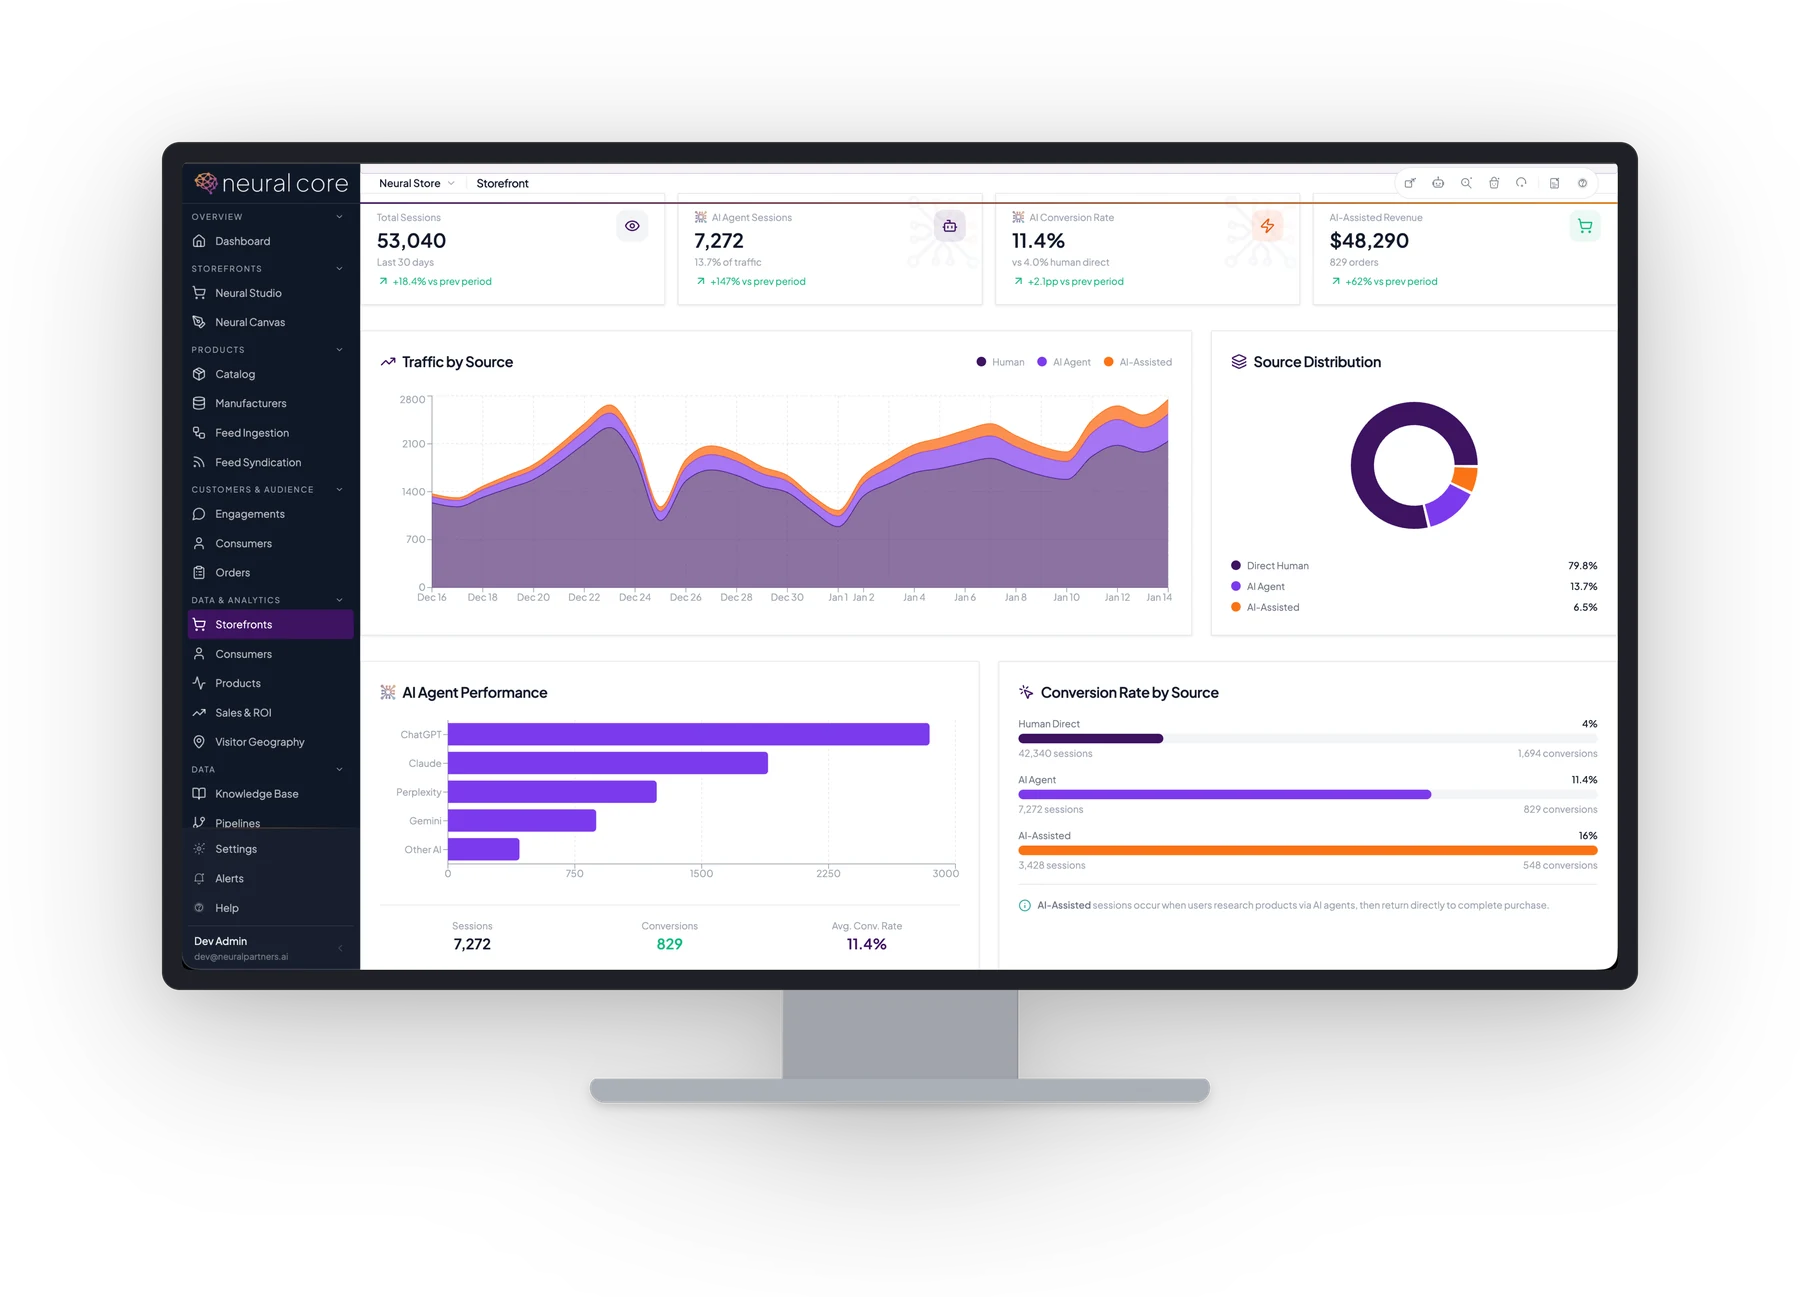
AI agent sessions broken out from human traffic. Conversion rate by source — ChatGPT, Claude, Perplexity, Gemini. Top AI queries, zero-result gaps, live session feed, visitor geography down to the zip code. The full picture of what's happening across your storefront, in one place, updated continuously — not stitched together across five tools.

Built on the same data your personalized agent reads from and your workflows trigger off. One source of truth for the people running the business and the agents helping them.

A Neural Core storefront analytics dashboard with traffic-by-source, source distribution, AI agent performance, and conversion rate by source.
Live Demo

The AI Visibility Dashboard Your Reporting Stack Doesn't Have.

A live look at the full storefront surface — AI agent attribution, conversion rate by source, top AI queries, live session feed, and 30-day traffic trend with AI traffic stacked separately. The signals legacy analytics tools can't see, in one place, updated continuously.

Your Reporting Stack Was Built for a Web That Doesn't Exist Anymore

01

AI traffic is invisible in legacy analytics.

Google Analytics still classifies a ChatGPT-referred session the same as a random Reddit click. AI agent traffic is growing 100%+ year over year — and it's not showing up correctly anywhere your team is looking, which means you can't measure it, attribute it, or learn from it.

02

The data lives in five dashboards that never agree.

Sessions in GA. Conversions in Shopify. Email engagement in Klaviyo. Search behavior nowhere visible. Geography buried in an export. Stitching the picture together is a quarterly ritual that's stale before it's finished — and missing the AI-specific signals entirely.

03

Search data is the leakiest blind spot.

What customers are searching for, what they're not finding, where the catalog has gaps — most teams have zero visibility into the search bar that drives a third of their on-site conversions. Every zero-result query is a customer who came looking and left without anyone knowing.

04

Insights you can't act on aren't insights.

A monthly PDF that lands the third Tuesday tells you what already happened. By then the campaign's over, the gap's grown, the customer's gone. Real reporting has to be live, in the same surface your team and your agent already work in.

Every Storefront Signal, Live, in One Place

Traffic, AI attribution, search behavior, customer activity, geography, sales and ROI — all surfaced in dashboards your team and your agent both work from. Live updates, exportable views, scheduled digests. Private to your account, never pooled across tenants.

Unified Storefront Dashboard

Total sessions, AI agent sessions, AI conversion rate, AI-assisted revenue — the top-line numbers up front, with deltas vs. the prior period built in. Last 30, custom range, per-storefront filtering.

AI Traffic Attribution

Direct human, AI agent, and AI-assisted sessions tracked and tagged separately as they arrive. Conversion rate, revenue, and behavior charted by source — so the AI channel finally gets measured like the channel it is.

AI Agent Performance Breakdown

Sessions and conversions broken out per agent — ChatGPT, Claude, Perplexity, Gemini, and the rest. See which AI surfaces actually convert for your catalog, which are growing, and where you should be optimizing.

Top AI Queries & Live Session Feed

What AI agents are actually asking your catalog about, in plain language, with conversion counts attached. A live feed of recent AI sessions — what was viewed, what was converted, what was just browsing — so you can watch the channel in real time.

Search Analytics

Total query volume, zero-result rate, average latency, search method mix, query trends over time. The visibility into the on-site search bar that most analytics stacks pretend doesn't exist.

Zero-Result Query Surfacing

Every search that returned nothing surfaced and ranked by frequency — the precise list of products customers want that your catalog doesn't carry, or carries under different names. The fastest catalog feedback loop your team has ever had.

Product & Customer Activity Logs

Every product save, favorite, list add, and lookup logged with timestamp, user, list, price at save, and storefront. The full audit trail of customer activity across your catalog — without bouncing between four CRMs to assemble it.

Visitor Geography

Sessions mapped down to the zip code, with top markets ranked by volume. Filterable by date, storefront, and channel — so you know exactly where your demand is concentrated and which markets are emerging.

Sales & ROI Reporting

Forms 30d, conversion rate, average order, retention 90d — surfaced with deltas vs. the prior period built in. The numbers your finance team needs to see, in a format they can actually read, updated continuously.

Exportable, Shareable, Scheduled

Any view exports to CSV or PDF. Dashboard URLs share with your team. Email digests scheduled to land in inboxes on the cadence each stakeholder needs — daily, weekly, monthly — no BI engineer required.

Common Questions

How is AI traffic attributed separately from human traffic?
Sessions are tagged by source as they arrive — direct human, AI agent (ChatGPT, Claude, Perplexity, Gemini, others), or AI-assisted (humans who researched via an AI agent and returned). Each source gets its own session count, conversion rate, and revenue attribution, surfaced side-by-side in the storefront dashboard.
What search analytics do I get?
Total query volume, zero-result rate, average latency, top queries, zero-result queries (the gaps in your catalog customers are searching for), and search method mix. Updated live, with historical ranges and per-storefront filtering.
Does this replace Google Analytics?
For most accounts, yes. Insights & Reporting gives you traffic, conversion, AI attribution, search, and ROI in one place — without the cookie-deprecation and AI-traffic blind spots GA struggles with. For accounts that need GA for legacy reasons, the two run side-by-side cleanly.
How often does the data update?
Live. Sessions, queries, and conversions flow into the dashboards in near-real-time. Historical roll-ups update on a continuous schedule so anything you look at — last 30 days, last quarter, custom range — reflects the latest state of the account.
Can I export or share dashboards?
Yes. Export any view to CSV or PDF, share dashboard URLs with your team, and schedule recurring email digests. The data your finance and ops teams need is one click away — no separate BI build.
Is reporting data private to my account?
Yes. Every signal — visitor sessions, queries, conversions, geography — stays inside your tenant. Nothing pooled across customers, nothing exported to vendor analytics, nothing surfaced to other accounts. Same data isolation as the rest of Neural Core.