
Advertising report overview
The Advertising report shows what Google Ads measured about your campaigns, including spend, clicks and the conversions Google counted. Open it to see where your ad spend went over a date range.
Every figure on this report is Google’s own. It reads top to bottom: what Google measured, what Google counted as a conversion, the trends, then the detail behind every chart.
Before you start
- You need the Marketing, Manager or Admin role.
- Your Google Ads account must be linked to Neural Partners. An Admin enters your Google Ads CID in Settings > Digital Settings > Integrations, then you accept Neural Partners’ manager-account link request in your Google Ads account. Without both, the report stays on “Google Ads is not available for this storefront”.
- Until an account is linked, the page says “Google Ads is not available for this storefront”. Once it is, figures arrive with the next daily update.
Steps
-
In the sidebar, under Neural Analytics, select Advertising.
-
Read What Google measured for spend and engagement.

-
Read What Google counted as a conversion for the conversion figures.
-
Select By click date or By conversion date to change how the counted conversions are dated. This re-dates Google conversions (counted) and Google conversion value only. Google measured and the Conversion actions tab are always dated by click, and campaign rows aren’t available under By conversion date.

-
Scroll to Trends to see where the spend went day by day.
-
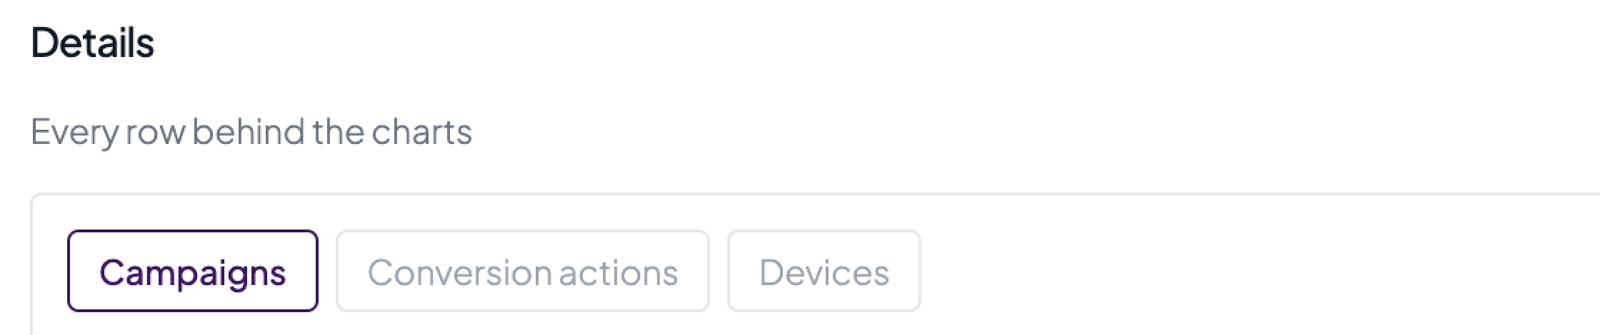
Under Details, select a tab to see the rows behind a chart.
-
Select the question mark on a tile to read what that number means.
Good to know
What Google measured
- Spend, Impressions, Clicks, CTR and Cost per click are Google’s own figures for the range.
- Amounts are in your Google Ads account’s currency.
- Conversions can be fractional, such as 5.81, because Google splits credit for some conversions.
- These are the most solid numbers on the page. Both halves of every ratio come from Google.
Two conversion figures
- Google measured is every conversion action Google recorded, including store visits, directions and calls.
- Google conversions (counted) is only the actions your ad account marks as primary. This is the figure Google shows as “Conversions” in its own console.
- Both are right, and the gap between them is usually large. For a showroom, the measured figure is usually the one that matters, because it is the only one that includes people walking in.
- Part of the measured figure is Google’s estimate, not a count of confirmed actions. Google estimates store visits statistically, and “Local actions” is a group Google does not itemise.
- An action can read zero in Google’s “Conversions” column and still be large under Google’s “All conversions”. This report shows the measured figure.
Conversion value is not revenue
- Google conversion value is Google’s own pricing of the actions it counted. It is not money you received.
- Google measures these conversions on the pages its own tag tracks, which may not be your storefront. Don’t compare this figure with your sales.
- Your sales are in the Showroom report. The two reports are separate on purpose.
No return on ad spend
The report has no return on ad spend figure, by design. It would divide a number from Google by a number from a different system. Google’s figures are shown as Google’s and are never divided by your store’s.
Trends
Six charts: Daily spend, Daily clicks, Daily conversions, Spend by campaign, Conversions by action and Spend by device.
- Conversions by action shows what Google is counting, such as add-to-cart events, calls, store visits and directions.
- Spend by device comes entirely from Google’s own data.
- Google revises its figures after the fact. Spend and clicks settle within a few days. Conversions can change for up to 90 days, so don’t treat recent conversion figures as final.
Details
One table with three tabs: Campaigns, Conversion actions and Devices.
- Campaigns is ranked by spend and lists each campaign with Channel, Spend, Clicks, CPC, Conversions and Active days. Campaign conversions are always dated by click.
- Conversion actions lists each action with Measured, Counted and Value, ranked by Measured.
- Devices lists each device with Spend, Clicks, Impressions and Per click.
- There is no click-through rate per campaign, because Google does not break impressions out by campaign.
Ranges with only part of Google’s measured figure
Google’s measured figure, the device split and the per-action breakdown start from the first day collected for your account. A range can reach back before that day.
- For a range that is only partly covered, the Google measured tile shows no number. It says only some days in the range have Google’s measured figure, so a total would not be comparable with the counted figure beside it.
- For a range entirely before that day, it says the range predates Google’s measured figure: “It is not zero — it was not collected.”
- The notes for the per-action detail and the device split say how many days they cover, such as “Covers 3 of 18 days”.
- Pick a shorter, more recent range for a complete picture.
Dates next to the Showroom report
Google cuts its days in your ad account’s time zone. The Showroom report cuts its days at midnight UTC. When your ad account isn’t on UTC, the page reminds you. Comparing the two over a week or more is sound. Comparing a single day is not.