
Showroom report overview
The Showroom report shows how many people and automated visitors reached your website, what sold, and where your buyers came from. Open it to see how your website did over a date range.
The report reads top to bottom: the headline numbers, where your sales came from, the trends, then the detail behind every chart. Every number covers the date range the page is set to.
Before you start
- You need the Marketing, Manager or Admin role.
Steps
-
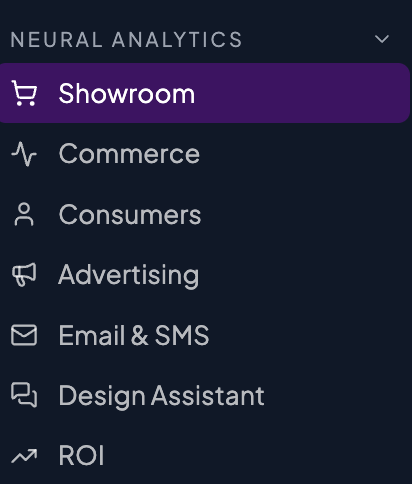
In the sidebar, under Neural Analytics, select Showroom.
-
Read At a glance for the headline numbers.

-
Read Sales by source to see where your buyers came from.
-
Scroll to Trends to see how traffic and sales moved day by day.
-
Under Details, select a tab to see the rows behind a chart.

-
Select the question mark on a tile or card title to read what that number means.
Good to know
At a glance
- Automated requests counts every bot, crawler and AI agent request at the network edge, before it gets to your store.
- Reached your store counts the automated requests your store itself served.
- Human visitors, Revenue and Orders are your people and your sales.
- Revenue is sales minus refunds, with each refund counted on the day it happens. A refund never reduces Orders.
- Automated requests and Reached your store are counted at two different points and shown side by side. Read each on its own. One is not a share of the other, and they don’t subtract.
- A small daily line appears on a tile only when there is a daily series behind that exact number.
- Colour tells you what is being counted: purple is automated traffic, teal is people, orange is money.
When Automated requests is unavailable
The tile says why, in one of three ways. None of them is a zero.
- “No automated-traffic data was collected for this range.”
- “Edge measurement isn’t available for this range. This is not a zero.”
- A note that your website shares a domain. The edge count exists only for a website on its own domain.
A line such as “Edge measurement covers 116 of the 236 days with data in this range.” means the edge count has data for only some of the days that have data. It counts days with data, not days in the range.
Sales by source
The Revenue by source card splits your orders by where each buyer first came from.
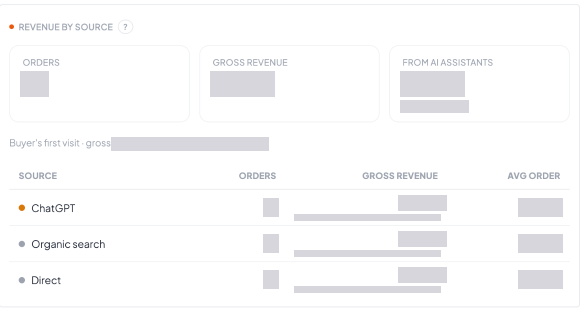
- Each order is credited to the source of the buyer’s very first visit, not the last click before buying. A buyer who found you through an AI assistant and came back later from a bookmark still counts for the assistant.
- The credit is per browser or device. A buyer who first found you on a phone and bought on a laptop is credited to the laptop’s first visit.
- Revenue on this card is gross: the order total as placed, before refunds. The Revenue tile at the top takes refunds off, so the two differ in a range with refunds. Neither will match a net figure in your accounting tool.
- Direct means the first visit carried no source: a typed address, a bookmark, or an app that hides where the visit came from. It is usually the largest source.
- Organic search includes Google’s AI results, because they arrive looking like ordinary Google. Only named assistants, such as ChatGPT, count as AI.
- Unattributed means we have no record of this buyer’s first visit, for example because it wasn’t recorded or can’t be shown for privacy reasons. It counts in the totals and shows last, in grey.
- Avg order is revenue divided by orders for that source. Read it beside the order count.
- From AI assistants adds up orders, revenue and share of revenue for every named assistant. One or two orders is a signal to watch, not a trend.
- The card says where buyers first came from. It does not say a source caused a sale.
The line under the Sales by source figures
- It states the basis and the count, such as “Buyer’s first visit · gross · 12 orders”.
- “Covers N of M days” means some days in the range have no source data. The figures are real but leave those days out.
- “Not available” means no day in the range has source data. It is never a zero. Source history starts on July 1, 2026, so pick a range that starts on or after that date.
- A dash in place of money means the range has orders but no currency label. Orders still show.
Why assistants can find you
This card is a checklist of your own settings, not a measurement of sales.
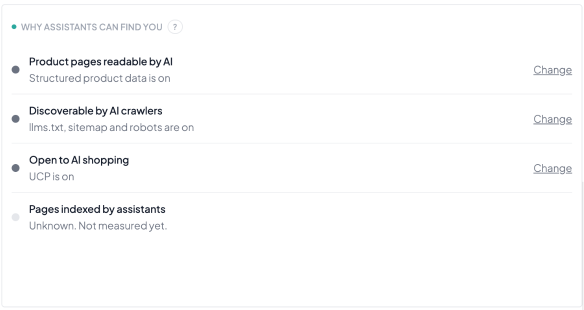
- Product pages readable by AI is on when structured product data is switched on, so assistants can read your product details.
- Discoverable by AI crawlers shows which of your llms.txt file, sitemap and robots file are on.
- Open to AI shopping is on when the shopping protocol that lets assistants buy is enabled.
- Pages indexed by assistants always reads unknown. Nobody measures this yet.
- Change opens the setting so you can turn it on or off yourself.
Trends
Eight charts: Traffic over time, Revenue over time, Funnel, Referrers, Automated traffic by purpose, Top agents at your store, Top crawlers at the edge and Top products by revenue.
- Traffic over time and its one-line summary use the automated requests that reached your store, next to human visitors.
- Automated traffic by purpose groups automated traffic by what it was for: AI agents, AI and search, Search and SEO, Social previews, Infrastructure and Unclassified. When it covers fewer days than the tiles above, it says how many.
- A chart that says there was nothing at your store, and points you to the edge, means the edge counted traffic but none of it reached the store.
- A bar below zero on Revenue over time is a day when refunds were larger than sales.
Details
One table with five tabs: Products, Agents at your store, Crawlers at the edge, By purpose and AI assistant referrals.
- Products lists each product with Human views, AI agent views, Add to cart, Purchases and Revenue. Product revenue is gross, so product totals can be higher than the Revenue tile in a range with refunds.
- Agents at your store labels each agent by how it was identified: verified, self-identified or inferred.
- Crawlers at the edge lists crawler names and request counts for the range. It doesn’t show when each request happened.
An empty Crawlers at the edge tab
- “No AI crawlers in this period” is a measured zero. The edge was checked and no AI crawlers came in that range. Try a wider range.
- “Edge crawler data is not available for this storefront” means your website isn’t on its own domain, so there is no edge to read.
When numbers arrive
Reports update once a day, early morning UTC, for the previous day. A day runs midnight to midnight UTC.
If the report is empty
“Analytics are not collecting yet” means your website has no analytics history yet.